
India’s industrial ecosystem has transformed significantly over the last two decades, and the Annual Survey of Industries (ASI) factory-count estimates provide a reliable window into this shift. Between 2004–05 and 2023–24, the number of operational factories in India almost doubled, reflecting growth in manufacturing activity, expansion of the formal industrial base, and improved industrial data coverage. However, this transformation has not been uniform. Some states like Tamil Nadu and Gujarat emerged as high-volume leaders, while others like Himachal Pradesh and Chhattisgarh became rapid-growth states. Meanwhile, administrative reorganizations—such as the formation of Telangana and Ladakh—changed how industrial activity was recorded and compared. This report presents a comparative view of industrial trends using factory unit counts, highlighting leaders, growth engines, emerging hubs, and best performers in terms of growth percentage.
| Parameter | Details |
|---|---|
| Data Source | Annual Survey of Industries (ASI), MoSPI |
| Timeline | 2004–05 to 2023–24 |
| Key Metric | Operational Factory Units |
| Core Themes | Growth, Regional Shifts, Best Performers, Reorganizations |
| Output Style | State-wise comparative analysis with tables |

1. National Overview: India’s Macro Industrial Trajectory
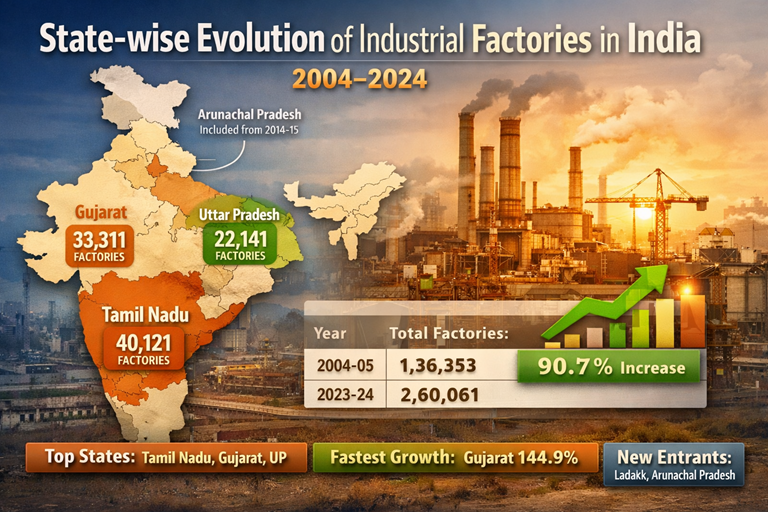
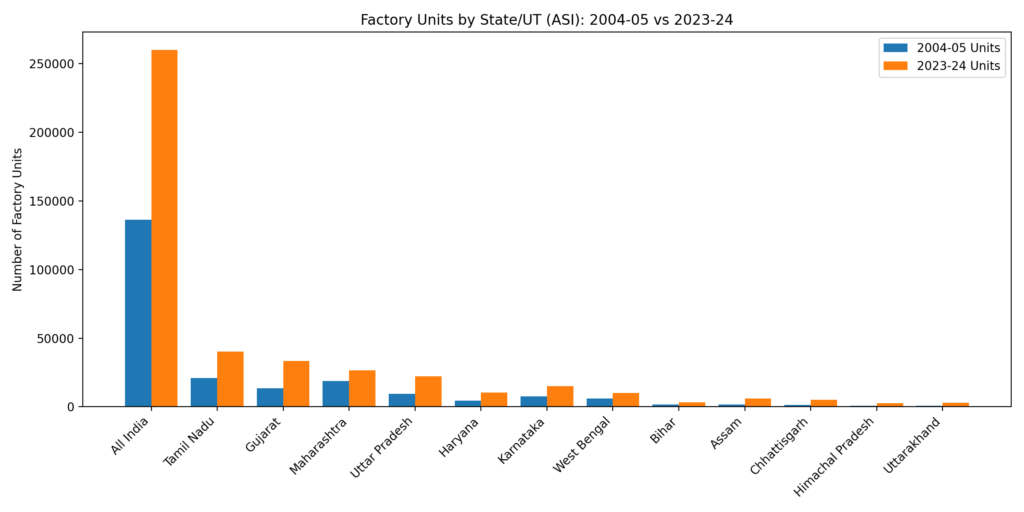
India’s industrial base has expanded at a scale that reflects both economic growth and broadening coverage of industrial registration. In 2004–05, the total factory count stood at 1,36,353 units. By 2023–24, it increased to 2,60,061 units—an addition of more than 1.23 lakh factories. This indicates a national growth rate of approximately 90.7% over twenty years.
A notable structural leap appears between 2009–10 and 2010–11, when the All-India count jumped from 1,58,877 to 2,11,660 factories in just one year. This spike is visible across major states, suggesting either a major surge in industrialization or a redefinition/expansion of ASI survey coverage and registration inclusion. Regardless, this year becomes the pivot point for interpreting industrial expansion across India.
Table: National Factory Count Growth
| Year | All-India Factory Units | Change |
|---|---|---|
| 2004–05 | 1,36,353 | Baseline |
| 2009–10 | 1,58,877 | +22,524 |
| 2010–11 | 2,11,660 | +52,783 (Sharp Jump) |
| 2023–24 | 2,60,061 | +48,401 (Post-jump growth) |
| Total Growth | — | +90.7% |
2. Gujarat (2023–24): How Many Factory Units?
Gujarat recorded 33,311 operational factory units in 2023–24, making it India’s second-largest state by factory count. This number shows Gujarat’s strong industrial expansion strategy over the last twenty years, driven by infrastructure development, port-based logistics advantage, industrial clusters, investment-friendly policies, and broad sectoral spread.
The state’s manufacturing footprint covers petrochemicals, textiles, pharmaceuticals, engineering goods, ceramics, and export-oriented industries. Gujarat’s industrial performance is also important because it reflects not just high absolute volume but sustained expansion across years. This 2023–24 figure confirms Gujarat’s position as a national manufacturing engine—especially compared to older industrial states showing slower growth or consolidation. In absolute volume, Gujarat is now a high-density industrial landscape and plays a central role in India’s production and export value chain.
Table: Gujarat Factory Count Snapshot
| State | 2023–24 Factory Units | Rank in India (by volume) |
|---|---|---|
| Gujarat | 33,311 | 2 |
| Tamil Nadu | 40,121 | 1 |
| Maharashtra | 26,539 | 3 |
3. When Arunachal Pradesh Was First Included in ASI
Arunachal Pradesh was first included in ASI factory estimates starting in 2014–15, appearing initially with around 124 factory units. The inclusion is meaningful because it indicates that the industrial survey framework gradually expanded beyond traditional industrial states into remote and frontier regions. Arunachal Pradesh is geographically challenging and historically less industrialized, so its entry into ASI reflects improved formal registration, industrial mapping efforts, and inclusion of smaller manufacturing units.
Over time, this trend mirrors India’s broader industrial policy aim: integrating the least industrialized geographies into the formal economy. While factory counts remain small compared to leading states, the first inclusion year becomes important for evaluating industrial growth in new zones. It also explains why comparisons with older states must account for different survey entry points across regions.
Table: Arunachal Pradesh ASI Inclusion
| State | First Included in ASI | First Reported Factory Units |
|---|---|---|
| Arunachal Pradesh | 2014–15 | 124 |
| Mizoram | 2019–20 | 215 |
| Lakshadweep | 2023–24 | 4 |
4. Highest Factories in 2010–11: Which State Led?
In 2010–11, Tamil Nadu recorded the highest number of operational factory units in India. This year is highly significant because it corresponds with a nationwide factory-count surge. Yet, Tamil Nadu’s leadership was not accidental—it reflects decades of diversified industrial development and deep SME-driven industrial ecosystems.
Tamil Nadu’s manufacturing strength comes from the automobile corridor near Chennai, textile and knitwear zones in Coimbatore–Tiruppur, engineering industries, leather, electronics, chemicals, and food processing. The state’s advantage lies in its wide industrial spread and consistent policy ecosystem, enabling steady growth regardless of national fluctuations.
Even when other states experienced sudden jumps, volatility, or later consolidation, Tamil Nadu remained the leader in factory units. Therefore, 2010–11 leadership strengthens the understanding that Tamil Nadu is the most industrially dense and structurally stable manufacturing state in the country.
Table: 2010–11 Leadership Indicator
| Indicator | Result |
|---|---|
| Year | 2010–11 |
| Highest Factory State | Tamil Nadu |
| National Event | ASI jump: 1,58,877 → 2,11,660 |
| Tamil Nadu Strength | Consistent, diversified industrial base |
5. Highest Factories in 2023–24: Which State Led?
In 2023–24, Tamil Nadu again ranked number one, recording 40,121 operational factory units, making it the only state to cross the 40,000 mark. This indicates not only high volume but also long-term manufacturing stability. Unlike many industrial states that fluctuate due to consolidation, industrial migration, or sector-specific downturns, Tamil Nadu’s growth has remained steady and structural.
The state’s industrial expansion is balanced across sectors, including automobiles, textiles, electronics, machinery, chemicals, and export manufacturing. It also benefits from a strong ecosystem of component manufacturers and supplier networks, which continuously generate new factory units and expand industrial depth. Its leadership in 2023–24 confirms Tamil Nadu’s position as India’s industrial anchor state and a stable manufacturing platform for both domestic and international companies.
Table: 2023–24 Volume Leader
| State | 2023–24 Factory Units | Status |
|---|---|---|
| Tamil Nadu | 40,121 | #1 in India |
| Gujarat | 33,311 | #2 |
| Maharashtra | 26,539 | #3 |
6. Gujarat Trend (2004–2024): What Does the Trajectory Show?
Gujarat’s factory count trend from 2004 to 2024 reflects one of the strongest growth trajectories among major industrial states. The state started with 13,603 factories in 2004–05 and rose to 33,311 in 2023–24, achieving 144.9% growth over two decades. Gujarat’s rise is both rapid and stable. The state experienced a major jump in 2010–11 (consistent with national reporting changes), but importantly, it retained momentum after that, steadily scaling up factory registrations.
Gujarat overtook Maharashtra in factory count during the mid-2010s and has since strengthened its lead. This trajectory confirms Gujarat’s rise as a high-volume manufacturing hub, driven by industrial corridors, port connectivity, investment inflows, and a strong ecosystem of SMEs and large manufacturing units. Gujarat’s trend represents growth without major contraction.
Table: Gujarat Growth (2004–2024)
| Year | Gujarat Factory Units |
|---|---|
| 2004–05 | 13,603 |
| 2010–11 | 21,282 |
| 2023–24 | 33,311 |
| Growth % | 144.9% |
7. Jammu & Kashmir Reorganization: Industrial Mapping Impact
The reorganization of Jammu & Kashmir on October 31, 2019, resulted in two Union Territories—Jammu & Kashmir (UT) and Ladakh (UT). ASI reflects this change by providing separate factory estimates from 2019–20 onward, enabling clearer industrial measurement. Ladakh entered the industrial record with 3 factory units in 2019–20, growing to 29 units by 2023–24, indicating slow but visible industrial inclusion. Jammu & Kashmir remained around 1,000 units, showing stability rather than strong growth.
The split impacted industrial analysis by improving data clarity: earlier, aggregated numbers could hide industrial differences between Ladakh’s high-altitude economy and J&K’s valley-based industrial ecosystem. Post-reorganization reporting allows targeted policy planning and regional industrial development focus. It also shows how political restructuring affects industrial statistics and development assessment.
Table: J&K and Ladakh After Reorganization
| UT | 2019–20 Units | 2023–24 Units | Trend |
|---|---|---|---|
| Ladakh | 3 | 29 | Rising |
| Jammu & Kashmir | ~1,000 | ~1,000 | Stable |
| Reorganization Date | — | Oct 31, 2019 | — |
8. Bihar Added: Industrial Trajectory and Growth Story
Bihar’s industrial evolution presents a story of mid-period acceleration followed by stabilization. In 2004–05, Bihar had 1,674 factory units, which grew to 3,386 units in 2023–24, giving the state a total growth of 102.3%—higher than the national average (90.7%). Bihar witnessed its strongest rise after the 2010–11 surge, peaking at 3,623 units in 2015–16, making it one of the states that benefited strongly from mid-period industrial inclusion and factory registration growth.
However, after 2016, Bihar’s factory count plateaued and stabilized around the 3,300–3,400 range, suggesting a phase of consolidation rather than continuous expansion. This indicates that Bihar has doubled its formal factory base but needs new industrial investments, infrastructure push, and policy catalysts to unlock a second growth wave.
Table: Bihar Industrial Growth Summary
| Year | Bihar Factory Units | Note |
|---|---|---|
| 2004–05 | 1,674 | Baseline |
| 2010–11 | 2,805 | Major Jump |
| 2015–16 | 3,623 | Peak |
| 2023–24 | 3,386 | Stabilization |
| Growth % | 102.3% | Above national avg |
Key States—2004–05 vs 2023–24 + Growth %
| State | 2004–05 | 2023–24 | Growth % | Performance |
|---|---|---|---|---|
| Tamil Nadu | 21,053 | 40,121 | 90.6% | Stable Leader |
| Gujarat | 13,603 | 33,311 | 144.9% | Best Major Growth |
| Maharashtra | 18,912 | 26,539 | 40.3% | Slow Growth |
| Uttar Pradesh | 9,582 | 22,141 | 131.1% | Strong Late Surge |
| Haryana | 4,339 | 10,389 | 139.4% | Rapid NCR Hub |
| Bihar | 1,674 | 3,386 | 102.3% | Above Avg |
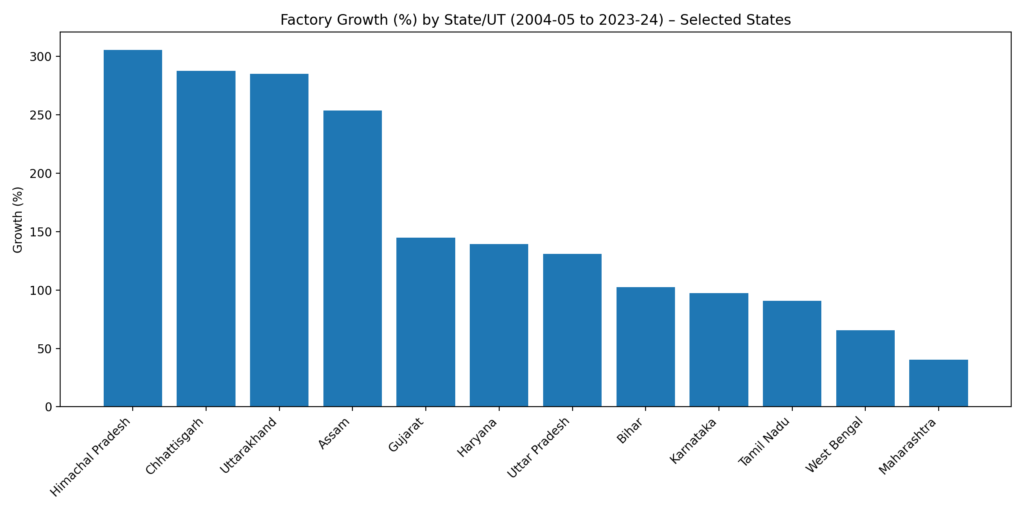
Best Performing States by Growth % (Top 8)
| Rank | State | Growth % | Category |
|---|---|---|---|
| 1 | Himachal Pradesh | 305.8% | Rapid Scaler |
| 2 | Chhattisgarh | 287.9% | Rapid Scaler |
| 3 | Uttarakhand | 285.2% | Rapid Scaler |
| 4 | Assam | 253.7% | Rapid Scaler |
| 5 | Gujarat | 144.9% | High-Volume Engine |
| 6 | Haryana | 139.4% | High-Volume Engine |
| 7 | Uttar Pradesh | 131.1% | High-Volume Engine |
| 8 | Bihar | 102.3% | Above Avg |


